Yesterday I received an email from Kristjan Liiva, a student at RWTH Aachen University Germany. Kristjan has developed a really cool dashboard to analyze and visualize the development of collaborative OSS projects by mining their mailing lists and software repositories. (If the link doesn’t work, try again later; the project is heavily under development). The result is a very interesting picture of social trends in collaborative OSS projects.
Kristjan has mined the mailing lists and repositories of Biopython, Bioperl and Biojava, all three bio* (‘biostar’) projects have large developer and user communities, and have been around for over a decade.
One thing Kristjan did, is create a graph for each year, where the nodes are people, and the edges are based on email communications. You see a map of what biopython looked like in the early days, 2000:
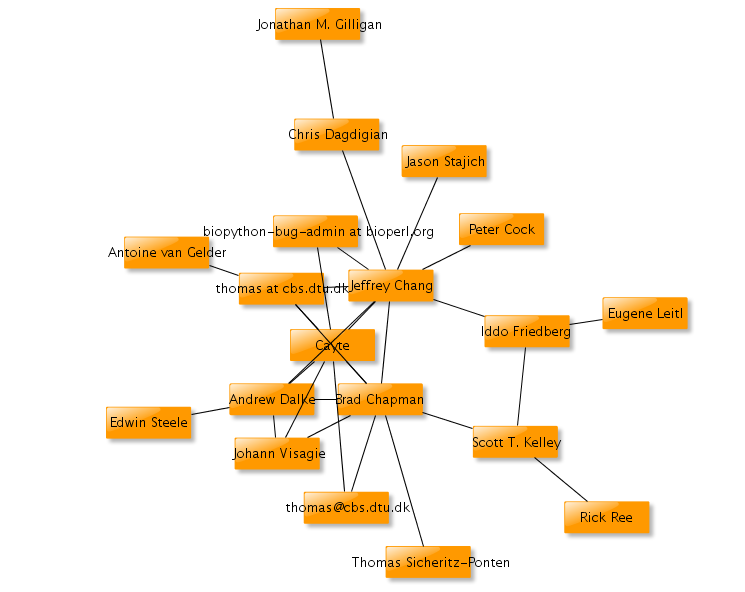
Note Jeffrey Chang (then a graduate student at Stanford), Andrew Dalke and Brad Chapman (then a graduate student at University of Georgia, Athens) with >5 edges each. They were quite busy at the time.
Biopython got bigger the next year (2001):
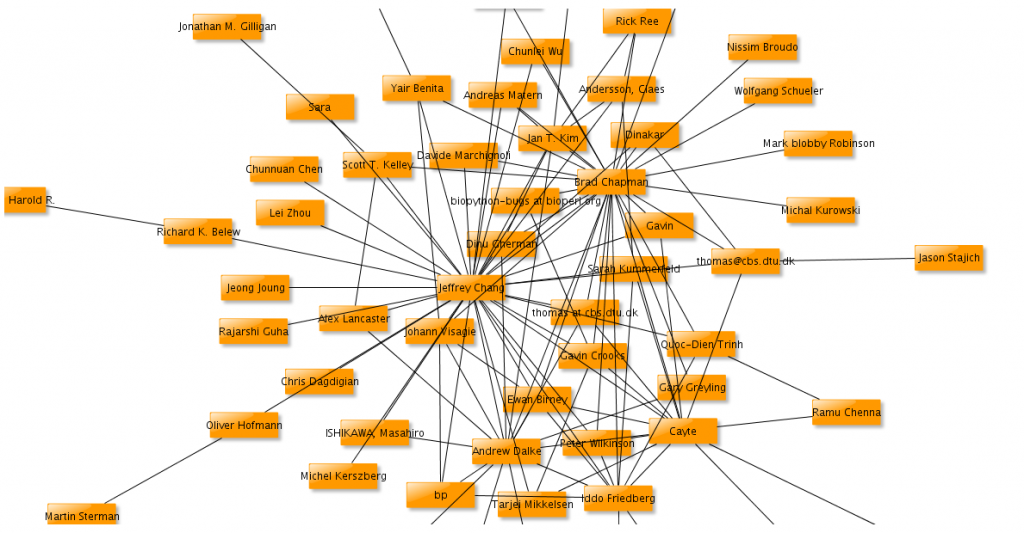
Note the same actors are the “hubs”: Brad, Jeffrey and Andrew. Although they have more edges now, and there are new, local hub actors. Of note is Thomas Hamelryck , who wrote most of the structural biology part of Biopython. But he appears in two nodes, (as thomas@cbs and thomas ‘at’ cbs), so his contribution has been diluted in this graph. Many, many of people contributed, and some got cut off by my rendering, sorry.
Here’s 2004:
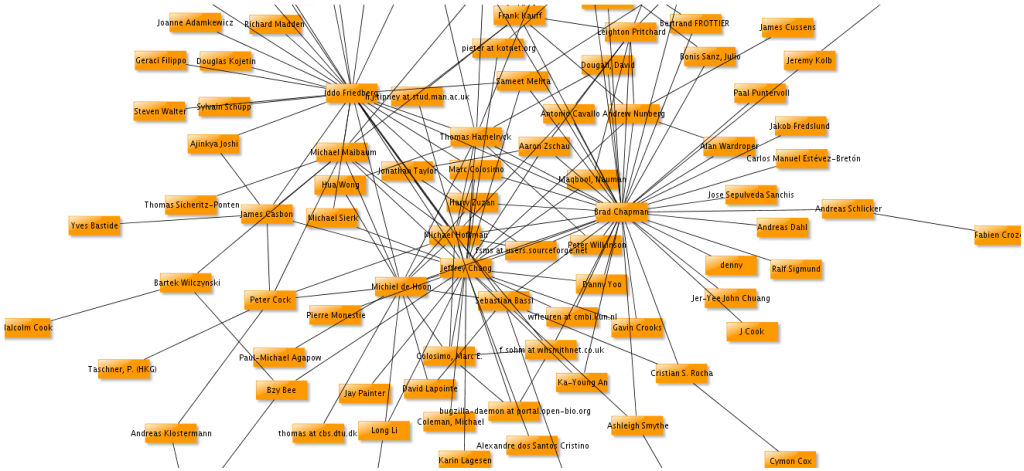
I was helping to roll releases, so I got kinda “hubbish” myself, with many edges on my node. A couple of years later I was looking for a new job, so I mostly dropped out of this scene.
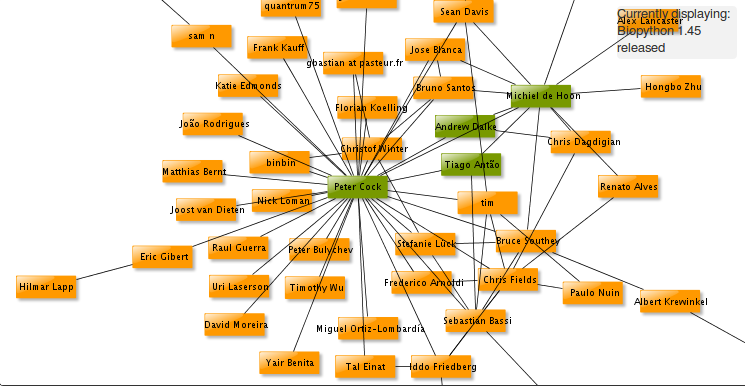
The last year on Kristjan’s dashboard is 2011:
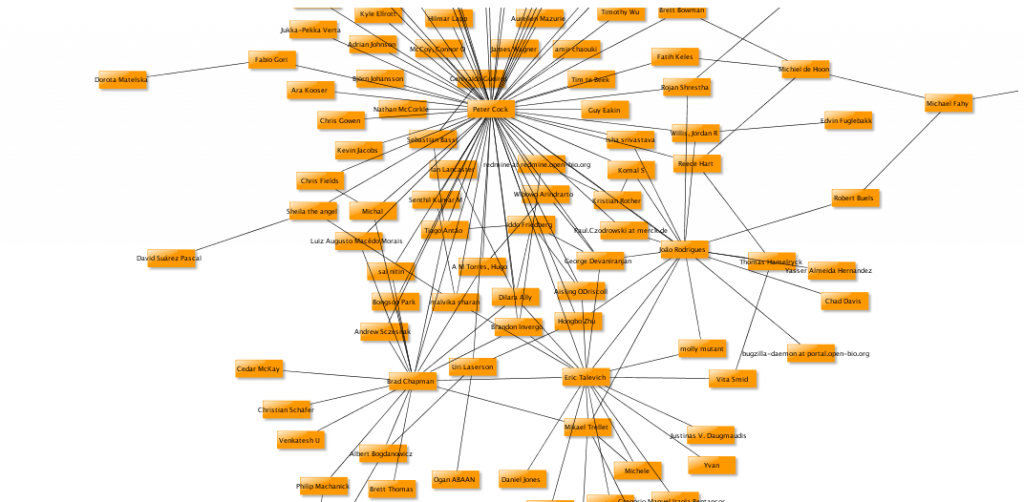
Peter Cock is the main active character in the graph (and he still is, and you are doing an amazing job Peter, BTW, probably not hearing that enough!) along with João Rodrigues, Brad Chapman, and Eric Talevich, among many others. Again, sorry about the cropped screenshot.
EDIT: if you go to the dashboard, and select “view by release” instead of “view by year” you can highlight the core contributors for each release. I assume that was done by number of contributions to the source versioning system.
Of course, there have many contributors over the years, and Biopython and the other bio* projects would not be so successful without all contributing users that provide such a diverse amount of code. Thanks to Kristjan for his work, and for letting me write about it. I’m looking forward to seeing this project develop. The social aspects of OSS projects are no less intriguing than the technological ones!


